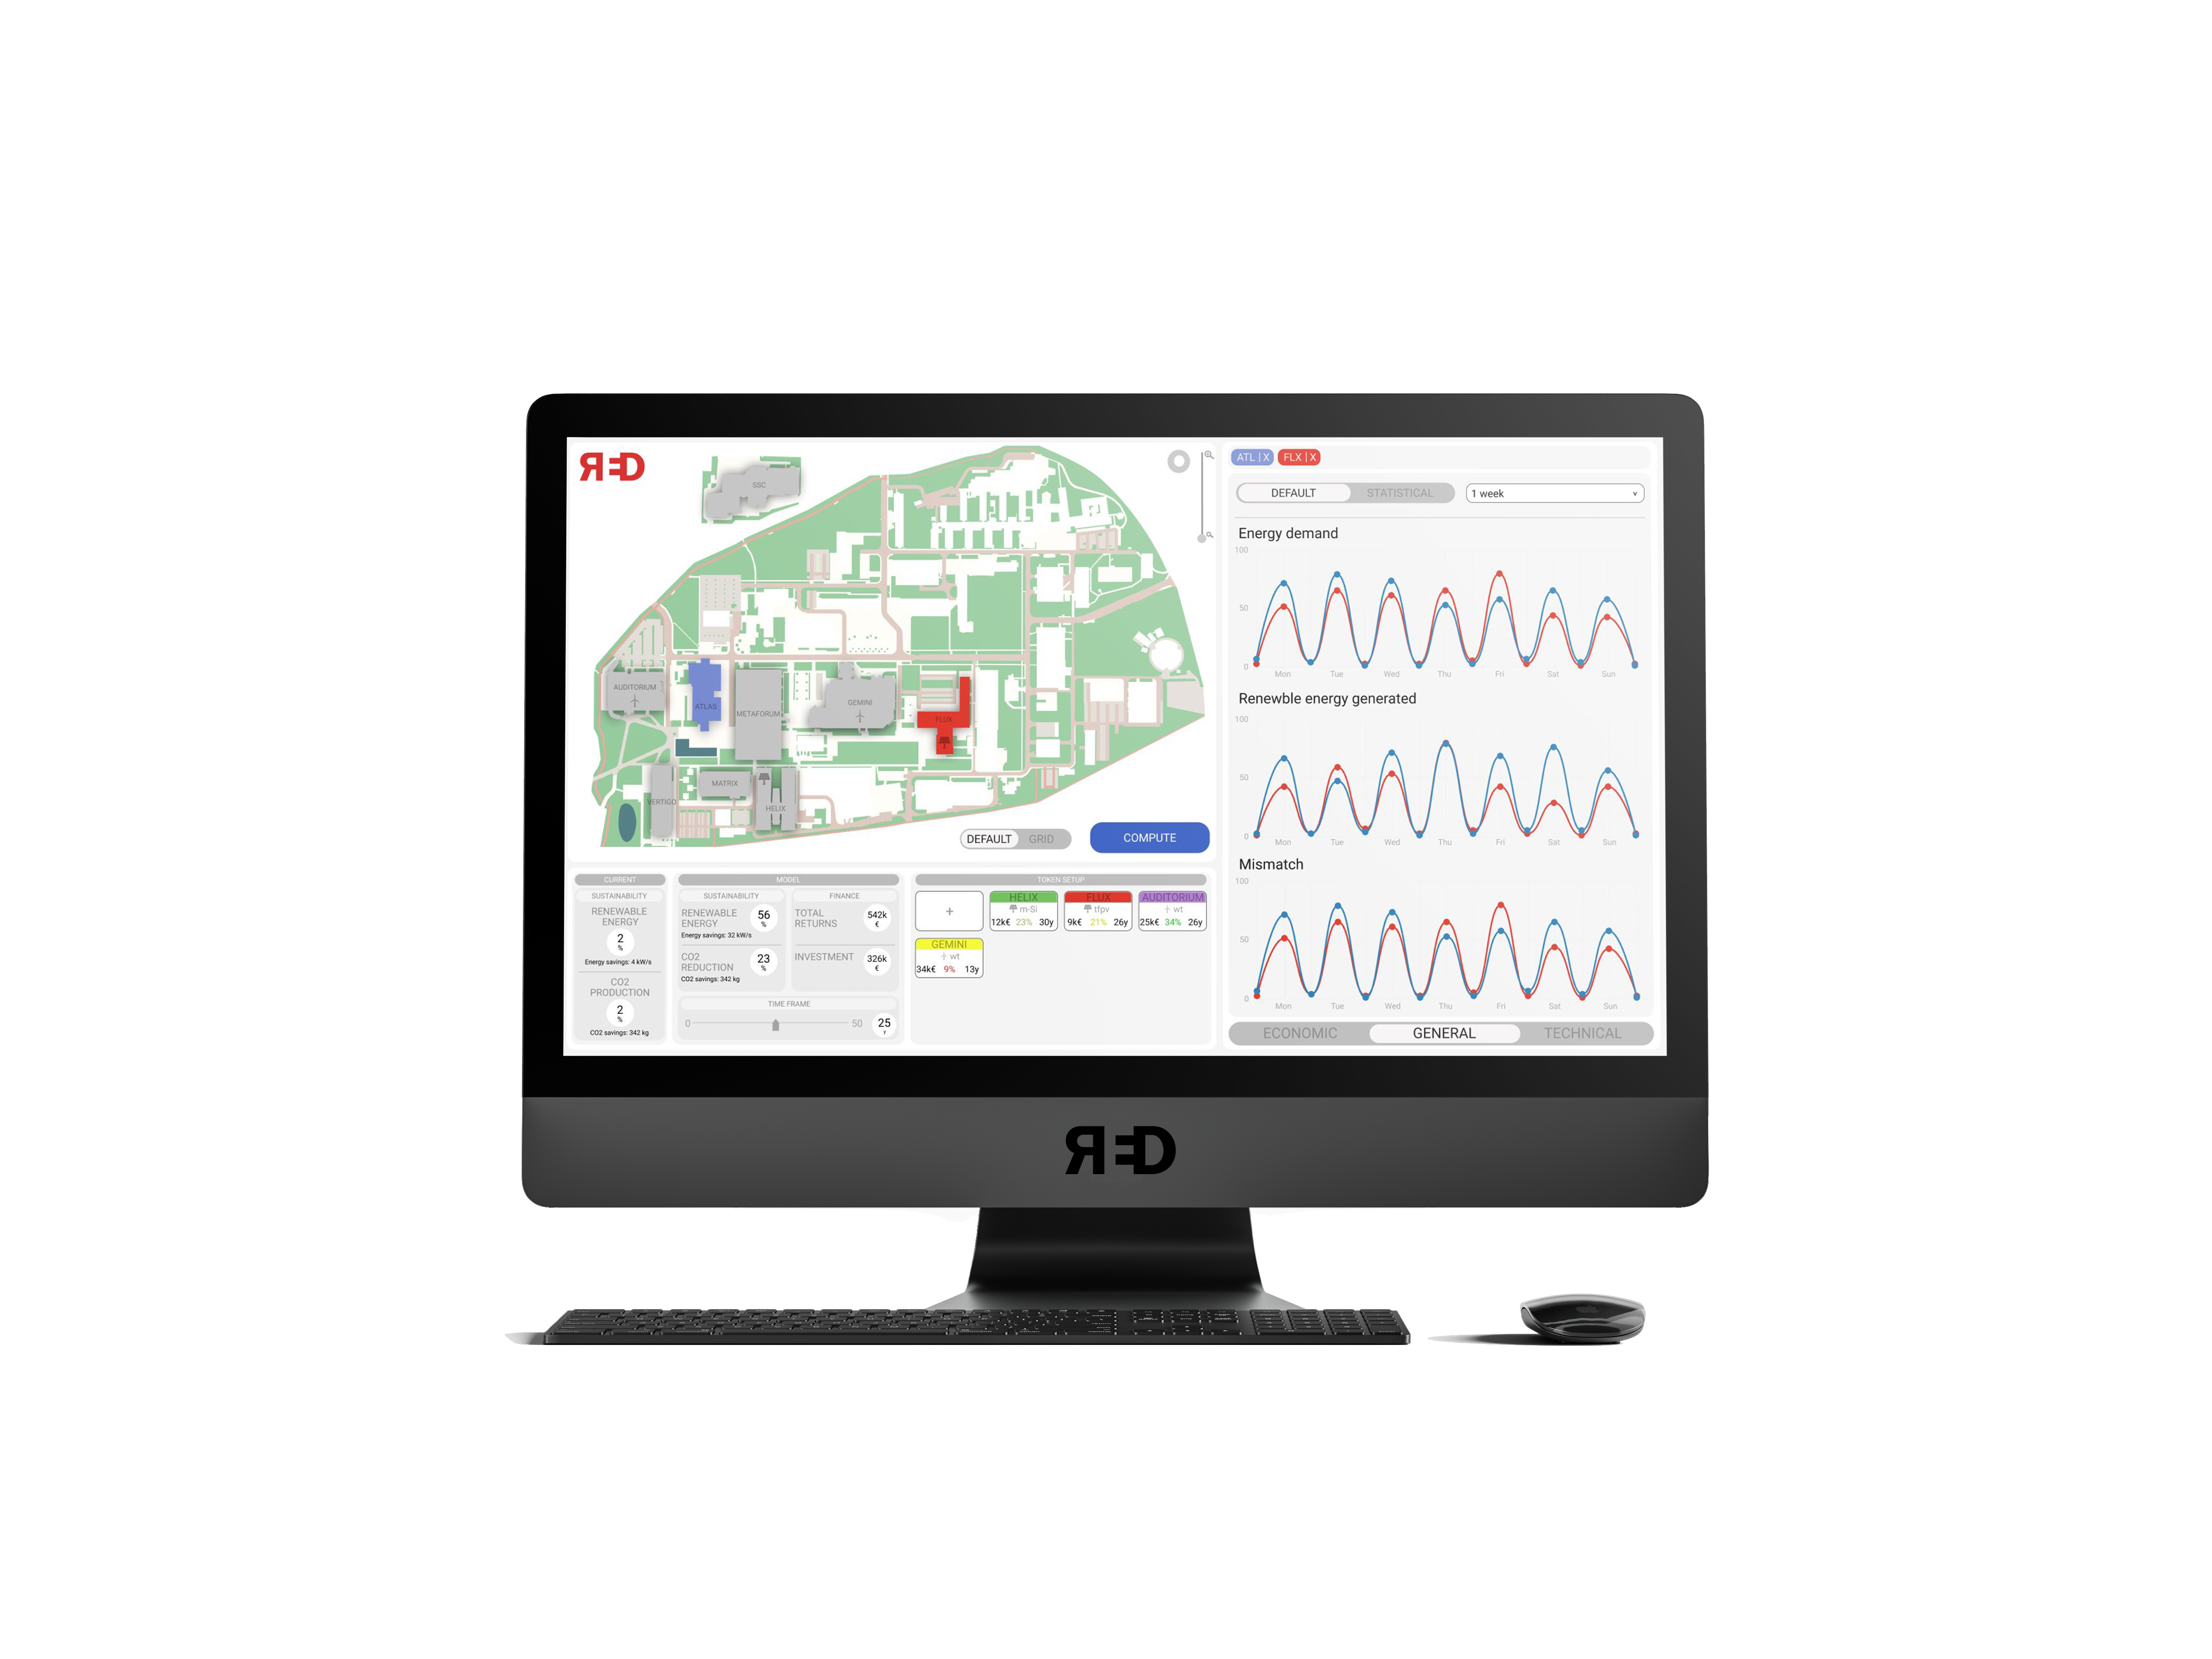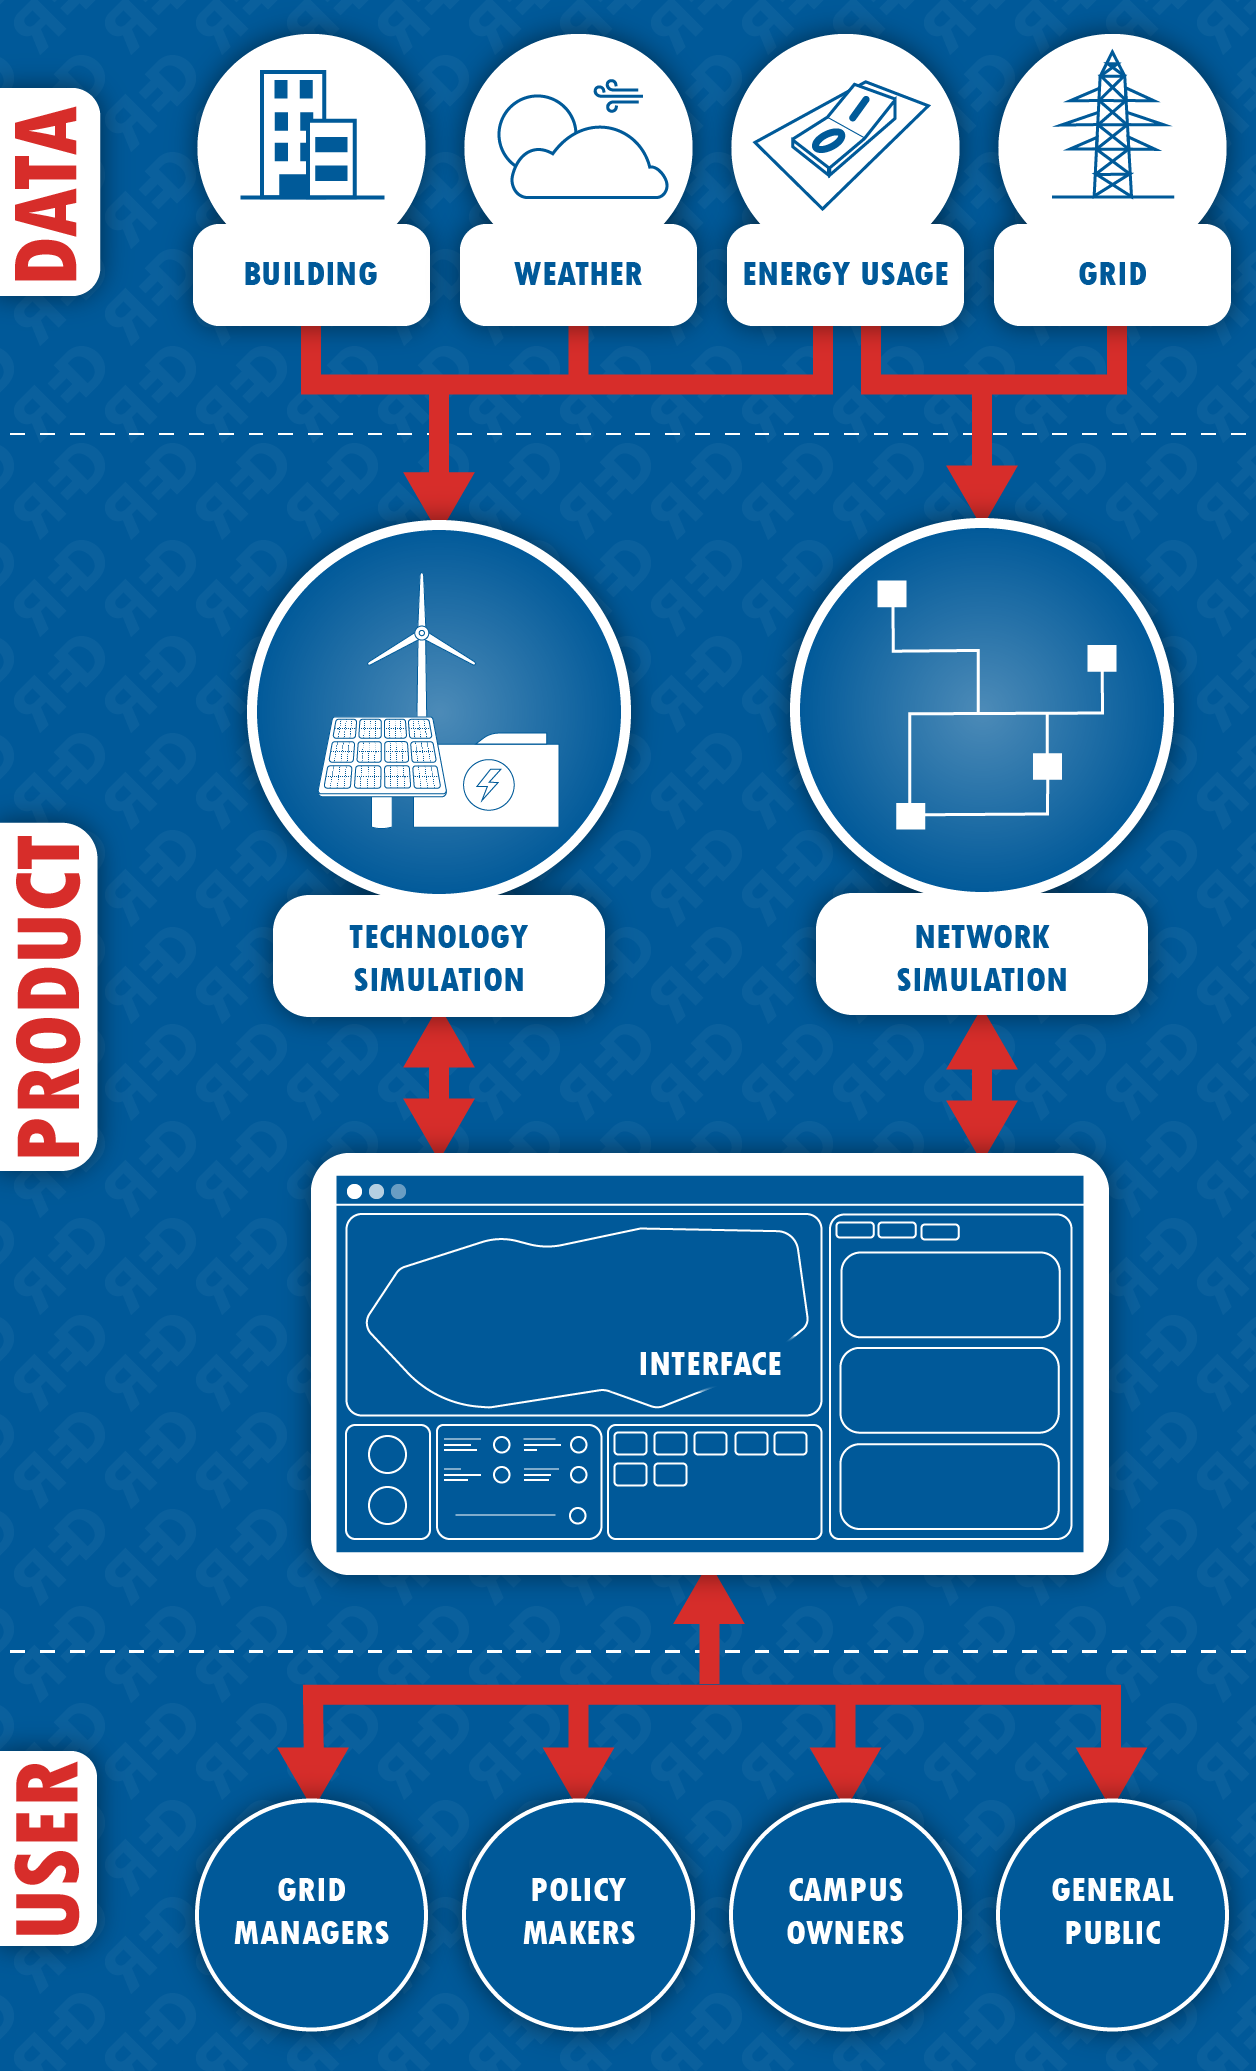
The digital interface is a medium to show the results of the calculations of the model in a neat and user-friendly manner. Since the physical model needs to be used by both stakeholders and people who use the campus, the interactions must be both informative, to support decision making, and entertaining, to invite passers-by to learn more about the energy grid of the campus. The interface is the link between the backend data model and the user.

The data model that Team RED is developing is intended to easily calculate changes in the energy system. The software uses building specification and electricity sensors data that we get from the university, as well as local weather data. The model can simulate the placement of energy assets of three different categories; generation, storage and sinks; and will then calculate the effect of these additions. The data model evaluates the impact by calculating the Net Present Value (NPV) and CO₂ savings within a certain timeframe. This is then used to give the average CO₂ savings per euro invested.
Tu/e
Minervum
